This tutorial covers a basic application and essential functions of SUMO for traffic analysis using an example network.
All files mentioned here can also be found in the <SUMO_HOME>/docs/tutorial/quickstart directory. The most recent version can be found in the repository at <SUMO_HOME>/tests/complex/tutorial/quickstart/data.
Example description#
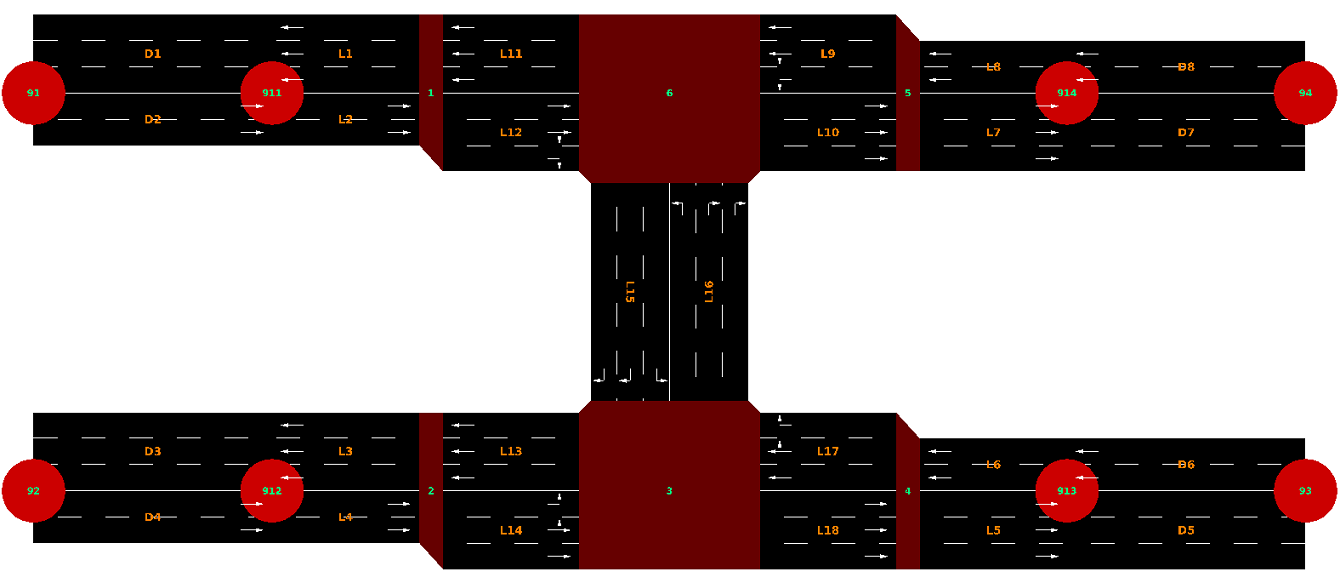
In this example, the traffic state will be analyzed with the application of SUMO. The example network includes four origins, four destinations, as well as two unsignalized intersections. In the investigated area, each road for outbound traffic has three lanes and the allowed traffic movements on each lane are restricted. U-turn behaviors are prohibited at all intersections. Moreover, a higher priority has been given to the eastbound and westbound traffic. The corresponding network layout is shown in Figure 1.1.
Figure 1.1. Network layout
Data Preparation#
Before conducting the traffic analysis in SUMO, the example network in Figure 1.1 should be first built with the information listed in Table 1.2. (Please note! Fig. 1.1 is not true to scale with the specifications given in Table 1.2!)
Table 1.2. Coordinate data of the example network
| node name | x-coordinate | y-coordinate |
|---|---|---|
| 91 | -1000.0 | +1000.0 |
| 92 | -1000.0 | 0.0 |
| 93 | +3000.0 | 0.0 |
| 94 | +3000.0 | +1000.0 |
| 911 | -500.0 | +1000.0 |
| 912 | -500.0 | 0.0 |
| 913 | +2500.0 | 0.0 |
| 914 | +2500.0 | +1000.0 |
| 1 | 0.0 | +1000.0 |
| 2 | 0.0 | 0.0 |
| 3 | +1000.0 | 0.0 |
| 4 | +2000.0 | 0.0 |
| 5 | +2000.0 | +1000.0 |
| 6 | +1000.0 | +1000.0 |
Network Editing with netedit#
Based on the coordinate data in Table 1.2 and the node-link-based network layout in Figure 1.1, the intersections, origins, and destinations are coded, respectively, as nodes 1-6 and nodes 91-94 by giving the respective x- and y-coordinates with the program netedit. Open netedit, which you can find in the bin directory of the SUMO-package. Then, create a new network ("File" -> "New Network...").
- Then choose the Edit mode, which is possible in two ways:

- Or you can use shortcuts to switch between modes, which you can see in the dropdown menu of the edit button:
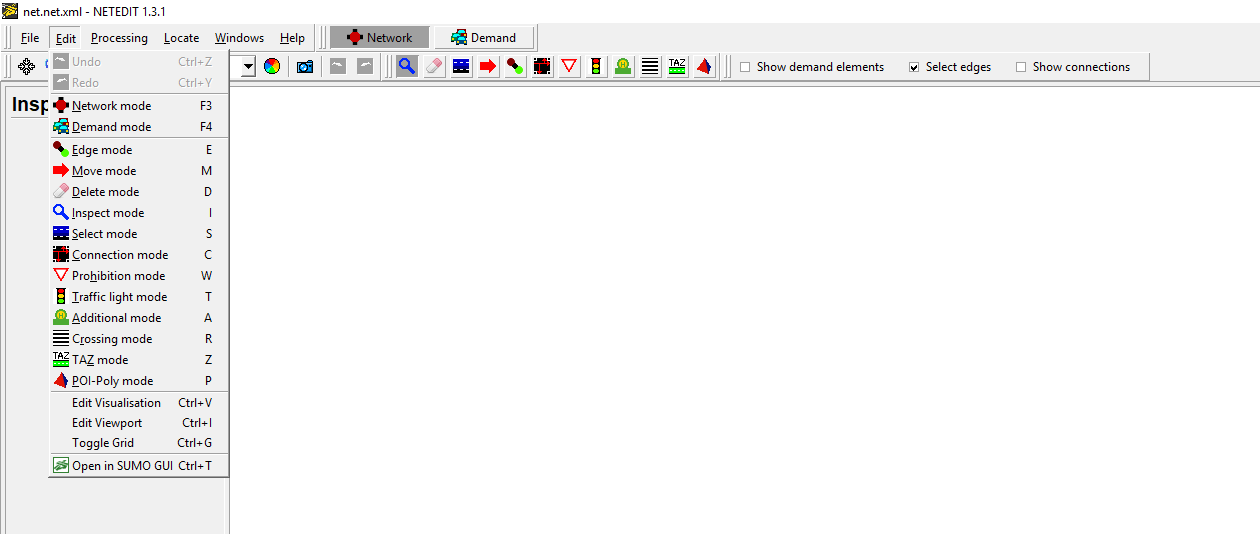
- First of all, you create one node and then a second one by clicking on the canvas. Both will be connected automatically and you will get your first edge.


- Next step is to switch to the Inspection mode and replace the name and the position of the nodes as defined in Table 1.2 above. Roads are represented as links in SUMO akin to other traffic simulation software. To define link characteristics, the identification (id) of each link has to be defined first either with numbers, word strings, or both. To edit these values, click on the red circle representing the junction using the left mouse button.
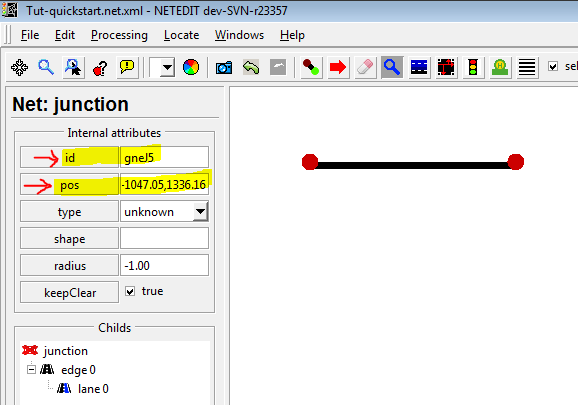
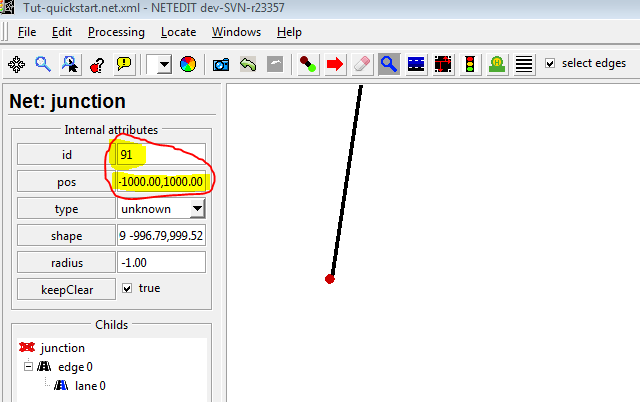
If you press Enter, you will get the new positions.
Now it is time to save your network: You are able to find a selection in
the dropdown menu of File. For our purpose here, the Save Network
As... is adequate. Please choose a suitable name for your network,
for instance quickstart.net.xml. You will use this name later on when
referring to the network from your configuration.
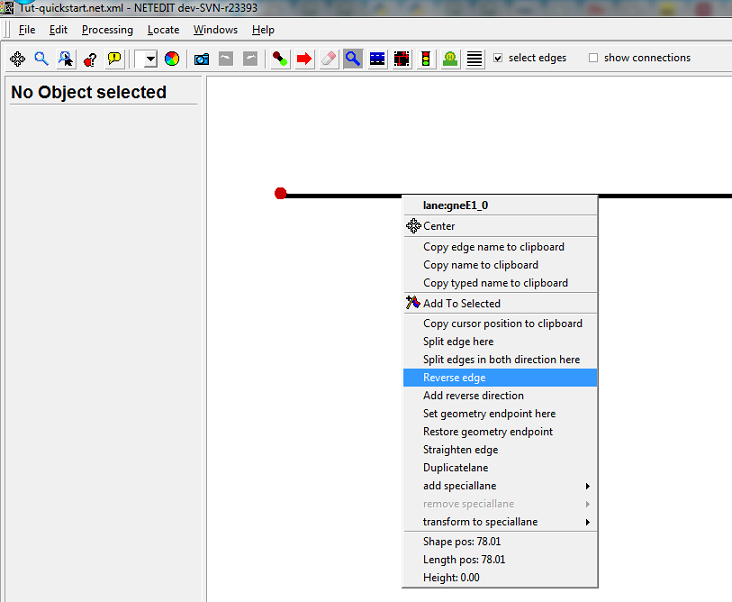
- As you can see in the given example, there are streets in both directions. To give your edge this information, you can either right-click on your created edge and choose Add reverse direction or select the option two-way during the creation process of an edge.

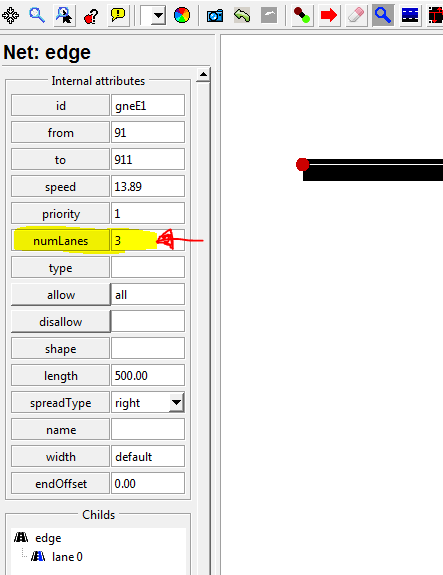
- Furthermore, one attribute must be changed to get a similar output as in the example description: the number of lanes. You can change the number of lanes easily if you are in the Inspect Mode and click on the relevant edge and change it directly.
Now you should be able to create the rest of the given nodes and edges in this example and change their names, the number of lanes, and reset their positions. Don't forget to save your work from time to time.
The junctions 911-914 aren't really needed. Splitting an length of road into multiple edges is necessary when an attribute such as speed or numLanes changes. Distinct edges may also be useful for analyzing the traffic performance in more detail. To model curved roads it is sufficient to modify the shape of an edge using 'move mode'.
- Next step would be to define the connections between the edges. To see which connections are already build automatically, please select the box show connections.
The default in SUMO is based on the given geometric design of all possible and logical traffic movements. U-turns are allowed if there is no corresponding specification. The default setting is that the right-most lane of each link is aligned to the right-most lane of the respective downstream link. In our example, the following connections are expected:
Table 1.3. The connections between the edges
| edge ID from | edge ID to | fromLane | toLane |
|---|---|---|---|
| L2 | L12 | 0 | 0 |
| L2 | L12 | 0 | 1 |
| L2 | L12 | 1 | 2 |
| L4 | L14 | 0 | 0 |
| L4 | L14 | 1 | 1 |
| L4 | L14 | 1 | 2 |
| L9 | L11 | 0 | 0 |
| L9 | L11 | 1 | 1 |
| L9 | L11 | 1 | 2 |
| L9 | L15 | 1 | 1 |
| L9 | L15 | 2 | 2 |
| L16 | L10 | 0 | 0 |
| L16 | L10 | 1 | 1 |
| L16 | L10 | 1 | 2 |
| L16 | L11 | 2 | 2 |
| L12 | L15 | 0 | 0 |
| L12 | L15 | 1 | 1 |
| L12 | L10 | 1 | 0 |
| L12 | L10 | 1 | 1 |
| L12 | L10 | 2 | 2 |
| L14 | L16 | 1 | 1 |
| L14 | L16 | 1 | 0 |
| L14 | L16 | 2 | 2 |
| L14 | L18 | 0 | 0 |
| L14 | L18 | 1 | 1 |
| L14 | L18 | 1 | 2 |
| L17 | L16 | 0 | 0 |
| L17 | L16 | 1 | 1 |
| L17 | L16 | 1 | 2 |
| L17 | L13 | 1 | 0 |
| L17 | L13 | 1 | 1 |
| L17 | L13 | 2 | 2 |
The meaning of each attribute is as follows:
- (a) from: ID of the link for which the traffic movements will be specified.
- (b) to: ID of the downstream link of the above defined link.
- (c) fromLane/toLane: lane number of the defined link in (a) and the lane number of the link in (b), which are connected.
If you change to Connection Mode, you will be able to specify new
connections or change existing connections. This is possible by clicking
on the chosen edge. As you can see on the left side of the following
picture, the different meanings of the dyed edges are shown in the
Legend. 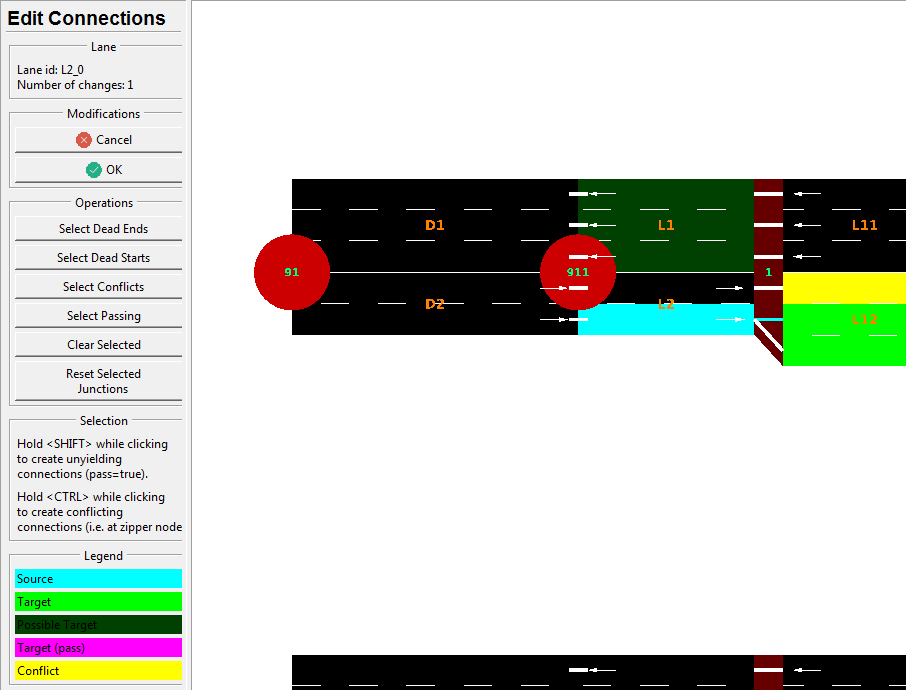 For further information and a deeper insight on this, please go to
netedit.
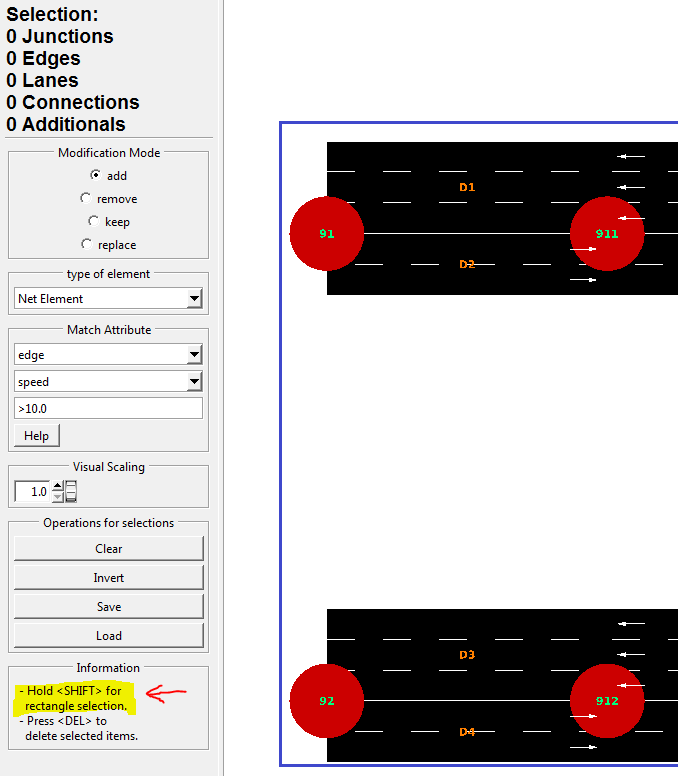
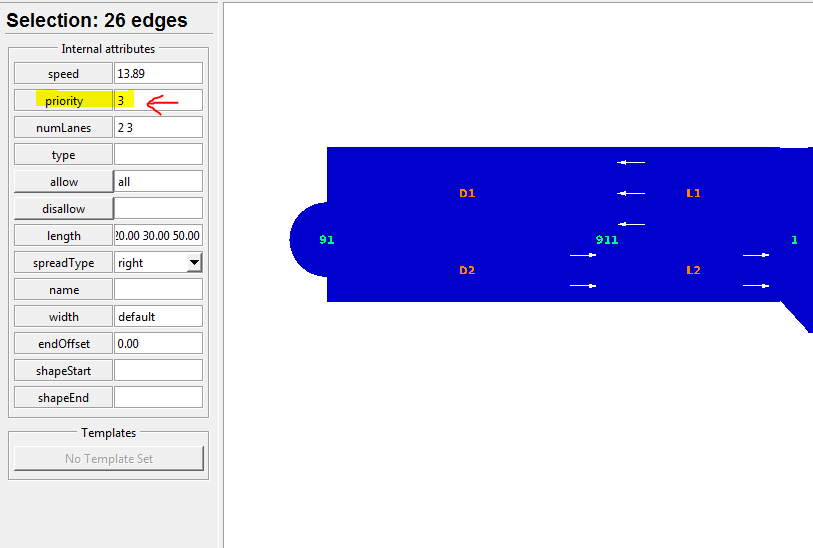
- Another topic is the priority of each edge. In our example, the priority is 1 by default. To change the priority, please select the edges you want to modify (see picture below). Switch to the Inspect mode. Then, you will be able to change the priority information of all selected edges by clicking on one of the selected edges. The eastbound and westbound roads in the example with 3 lanes and 2 lanes should have priority 3 and the northbound (L16) and southbound (L15) roads the (lower) priority 2.
Traffic demand#
For traffic demand, there are four vehicle types (Cars A, B, C, and D) in the example network. All drivers are 50% perfect in driving. The corresponding information is listed in Table 1.1. One vehicle per vehicle type is going to leave from each origin to each destination every 30 seconds in the period under investigation from 15:00 to 15:15.
Table 1.1. Vehicle types and vehicular characteristics in the example network
| Vehicle type | Max. acceleration(m/s) | Max. deceleration(m/s) | Length(m) | Max. speed(m/s) |
|---|---|---|---|---|
| Car A | 3.0 | 6.0 | 5.0 | 50.0 |
| Car B | 2.0 | 6.0 | 7.5 | 50.0 |
| Car C | 1.0 | 5.0 | 5.0 | 40.0 |
| Car D | 1.0 | 5.0 | 7.5 | 30.0 |
Traffic demand and route data is defined together with vehicle type data in a file with the extension .rou.xml. The corresponding format for the example network is shown in Listing 1.5.
Vehicle Types#
Listing 1.5 shows that all vehicle types are first defined according to the information in Table 1.1. The related attributes include:
- (a) id: ID of the vehicle type, defined by users with numbers, word strings, or both;
- (b) accel: maximum acceleration of the respective vehicle type (in m/s2);
- (c) decel: maximum deceleration of the respective vehicle type (in m/s2);
- (d) sigma: drivers’ imperfection in driving (between 0 and 1);
- (e) length: vehicle length (in meters);
- (f) maxSpeed: maximum vehicular velocity (in m/s);
- (g) color: color of the vehicle type. It is defined with 3 numbers (between 0 and 1) for red, green, and blue, respectively. Values are separated by comma and in quotes with no space between the values. For example, 1,0,0 represents the color red, 0,1,0 represents green, and 0,0,1 represents blue.
The sequence of the attributes can be changed. The attribute sigma is assigned as 0.5 for all vehicle types.
Listing 1.5. Traffic demand and route data (quickstart.rou.xml)
<?xml version="1.0" encoding="UTF-8"?>
<routes>
  <vType accel="3.0" decel="6.0" id="CarA" length="5.0" minGap="2.5" maxSpeed="50.0" sigma="0.5" />
  <vType accel="2.0" decel="6.0" id="CarB" length="7.5" minGap="2.5" maxSpeed="50.0" sigma="0.5" />
  <vType accel="1.0" decel="5.0" id="CarC" length="5.0" minGap="2.5" maxSpeed="40.0" sigma="0.5" />
  <vType accel="1.0" decel="5.0" id="CarD" length="7.5" minGap="2.5" maxSpeed="30.0" sigma="0.5" />
  <route id="route01" edges="D2 L2 L12 L10 L7 D7"/>
  <route id="route02" edges="D2 L2 L12 L15 L18 L5 D5"/>
  <route id="route03" edges="D2 L2 L12 L15 L13 L3 D3"/>
  <route id="route04" edges="D4 L4 L14 L18 L5 D5"/>
  <route id="route05" edges="D4 L4 L14 L16 L10 L7 D7"/>
  <route id="route06" edges="D4 L4 L14 L16 L11 L1 D1"/>
  <route id="route07" edges="D6 L6 L17 L13 L3 D3"/>
  <route id="route08" edges="D6 L6 L17 L16 L11 L1 D1"/>
  <route id="route09" edges="D6 L6 L17 L16 L10 L7 D7"/>
  <route id="route10" edges="D8 L8 L9 L11 L1 D1"/>
  <route id="route11" edges="D8 L8 L9 L15 L13 L3 D3"/>
  <route id="route12" edges="D8 L8 L9 L15 L18 L5 D5"/>
  <vehicle depart="54000" id="veh0" route="route01" type="CarA" color="1,0,0" />
  <vehicle depart="54000" id="veh1" route="route02" type="CarA" />
  <vehicle depart="54000" id="veh2" route="route03" type="CarA" />
  <vehicle depart="54000" id="veh3" route="route04" type="CarA" />
  <vehicle depart="54000" id="veh4" route="route05" type="CarA" />
  <vehicle depart="54000" id="veh5" route="route06" type="CarA" />
  <vehicle depart="54000" id="veh6" route="route07" type="CarA" />
  <vehicle depart="54000" id="veh7" route="route08" type="CarA" />
  <vehicle depart="54000" id="veh8" route="route09" type="CarA" />
  <vehicle depart="54000" id="veh9" route="route10" type="CarA" />
  <vehicle depart="54000" id="veh10" route="route11" type="CarA" />
  <vehicle depart="54000" id="veh11" route="route12" type="CarA" />
  <vehicle depart="54000" id="veh12" route="route01" type="CarB" color="1,0,0" />
  <vehicle depart="54000" id="veh13" route="route02" type="CarB" />
  <vehicle depart="54000" id="veh14" route="route03" type="CarB" />
  <vehicle depart="54000" id="veh15" route="route04" type="CarB" />
  <vehicle depart="54000" id="veh16" route="route05" type="CarB" />
  <vehicle depart="54000" id="veh17" route="route06" type="CarB" />
  <vehicle depart="54000" id="veh18" route="route07" type="CarB" />
...
</routes>
Traffic routes#
Following the vehicle type information, traffic route data needs to be defined, as well. The input attributes include:
- (a) id: ID of a certain route and defined by users with numbers, word strings, or both.
- (b) edges: The sequence of the names of the links, composing the defined route.
Traffic demand#
Traffic demand data are defined with four attributes:
- (a) depart: departure time of a certain vehicle.
- (b) id: ID of a certain vehicle and defined by users with numbers, word strings, or both.
- (c) route: the route used by the defined vehicle.
- (d) type: ID of the defined vehicle type.
Simulation#
Traffic simulation in SUMO can be conducted in two ways as described below. The overview of the simulation process is given in Figure 1.8.
All file names in brackets are the file names used in the example.
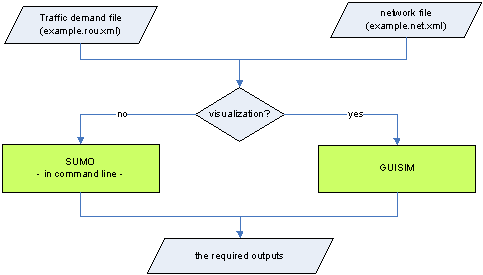
Figure 1.8. Overview of traffic simulation process
Command line#
An efficient traffic simulation execution can be achieved with the use of the command line, especially when dealing with large and sophisticated traffic networks. To simplify the execution process, it is recommended that all the required execution actions, e.g. the path and the name of the input files, the output types, the output directory, and the simulation time period is specified in a configuration file.
Listing 1.7. Configuration file for the traffic simulation of the example network (quickstart.sumocfg)
<?xml version="1.0" encoding="iso-8859-1"?>
<configuration xmlns:xsi="https://www.w3.org/2001/XMLSchema-instance"
  xsi:noNamespaceSchemaLocation="https://sumo.dlr.de/xsd/sumoConfiguration.xsd">
    <input>
        <net-file value="quickstart.net.xml"/>
        <route-files value="quickstart.rou.xml"/>
    </input>
    <time>
        <begin value="54000"/>
        <end value="54900"/>
    </time>
    <time-to-teleport value="-1"/>
</configuration>
We use the <time-to-teleport value="-1"/> option here to disable the automatic removal of vehicles which wait for too
long in front of an intersection.
For the example network, the respective configuration file is shown in Listing 1.7 and the traffic simulation can then be carried out with the use of the following command:
sumo –c quickstart.sumocfg
sumo-gui#
The application of sumo-gui is the other way to execute the traffic simulation with SUMO. During the execution, each vehicular movement and the traffic progression can be observed; and the possible bottlenecks can be visually identified. A configuration file for all execution actions, e.g. the one in Listing 1.7, is required for sumo-gui. Double-click on the Program sumo-gui.exe and a sumo-gui work window will automatically open. The investigated network can be activated by opening the corresponding configuration file under the File-Menu of the menu bar. Traffic simulation can then be performed by pressing the green triangle button in the main tool bar. The simulation can be stopped any time when the user presses the red squared button. A stopped simulation can be resumed by pressing green triangle if the simulation time is not up. An illustration example is given in Figure 1.9.
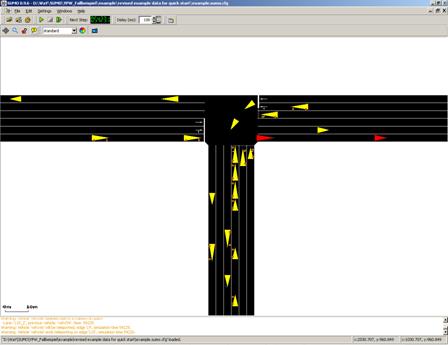
Figure 1.9. Illustration of the example network in sumo-gui
Note
If you start the tutorial with sumo-gui, the whole network is visible at first but no vehicles can be seen because the view is zoomed out very far. You need to zoom in by holding the right mouse button and moving the mouse to be able to see any vehicles. Furthermore, you need not set the delay value to something greater than 0. Otherwise, the simulation may be over very quickly and you might not be able to see vehicle movements.
Back to Tutorials


