Introduction#
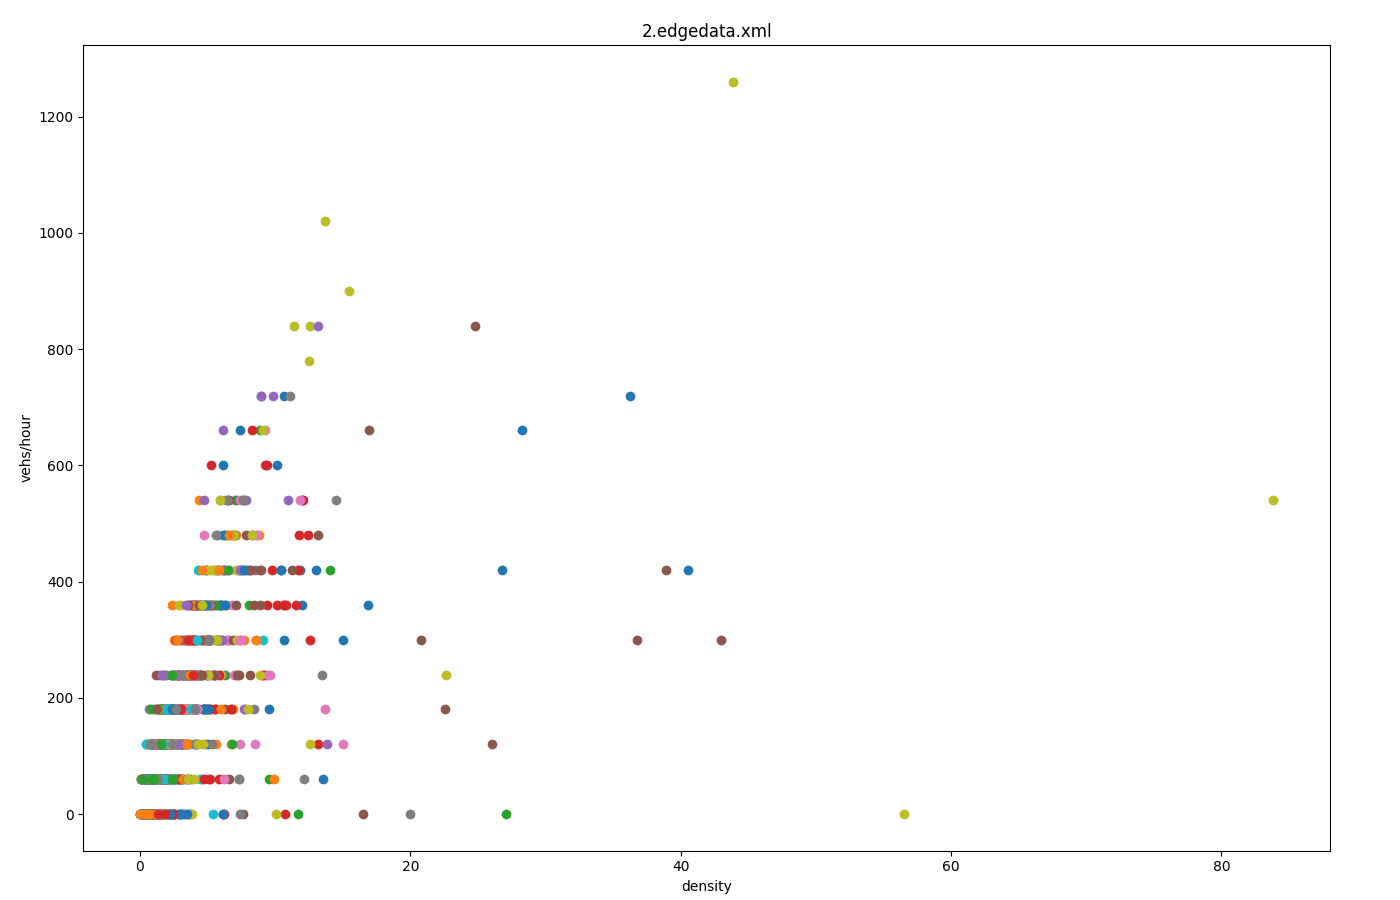
The Fundamental diagram of traffic flow describes the relationship between flow (vehicles per hour) and density (vehicles per km).
Both measures can be obtained from edgeData-output. The density value measures vehicles per km and the flow can be computed from entered * 3600 / period where period is the specified aggregation interval of the output.
Generally, this can be computed for any kind of scenario as long as this scenario covers the desired range of traffic densities.
Note
How to achieve high densities at vehicle insertion is explained at Road Capacity
Plots may be created with plotXMLAttributes.

Fundamental diagram of a closed circular route#
A common scenario that is used to generate the fundamental diagram is a circular route where the density is increased over time. Such a scenario can be found at <SUMO_HOME>/tests/sumo/cf_model/drive_in_circles.
There are different ways for increasing the density. The key problem that must be solved is that density can only be increased when there is sufficient space to insert additional vehicles. In a closed system, all the space is eventually taken up by the existing vehicles and the safety gaps between them. Additional space can only be obtained by lowering the speed in some parts of the circle to reduce these gaps. A special case are scenarios that feature spontaneous break down of speed and a traveling jam wave which permits different local densities over time.
Reducing the speed evenly#
An elegant way to reduce the speed is to initialize the network with evenly spaced vehicles at a predefined density. For the circle scenario this can be accomplished by the following demand definition:
<route id="circle" edges="6/1to7/1 7/1to8/1 8/1to9/1 9/1to10/1 10/1to1/1 1/1to2/1 2/1to3/1 3/1to4/1 4/1to5/1 5/1to6/1"/>
<flow id="0" type="default" route="circle" departEdge="random" begin="0" end="1" number="1000" departPos="last" departSpeed="15" departLane="free"/>
The disadvantage of this approach is the need to run the simulation multiple times with different values of departSpeed to achieve different densities.
Reducing the speed locally#
An alternative approach is to reduce the speed at some part of the circle repeatedly and insert vehicles downstream of the speed reduction where the local density is reduced for a time. This can be accomplished with the following definition (to be placed in an additional-file)
<variableSpeedSign id="disturbance" lanes="10/1to1/1_0">
    <step time="2000" speed="1"/>
    <step time="2100"/>
    <step time="3000" speed="1"/>
    <step time="3100"/>
    <step time="4000" speed="1"/>
    <step time="4100"/>
    <step time="5000" speed="1"/>
    <step time="5200"/>
    <step time="6000" speed="1"/>
    <step time="6200"/>
    <step time="7000" speed="1"/>
    <step time="7200"/>
    <step time="8000" speed="1"/>
    <step time="8300"/>
    <step time="9000" speed="1"/>
    <step time="9300"/>
    <step time="10000" speed="1"/>
    <step time="10300"/>
    <step time="11000" speed="1"/>
    <step time="11400"/>
    <step time="12000" speed="1"/>
    <step time="12400"/>
    <step time="13000" speed="1"/>
    <step time="13400"/>
</variableSpeedSign>
Caution
This speed reduction will introduce some small artifacts into the resulting fundamental diagram.
And a flow that continuously tries to add vehicles:
<flow id="0" type="default" begin="0" end="60000" period="3" departPos="last" departSpeed="max" departLane="free">
  <route edges="1/1to2/1 2/1to3/1 3/1to4/1 4/1to5/1 5/1to6/1"/>
</flow>
Reducing the speed spontaneously#
Some car-following models permit spontaneous break-down of flow given the right configuration parameters, density or lane changing situation. For the default Krauss carFollowModel, it is sufficient to set sigma ~ 0.8 to observe stochastic break-down at densities of ~ 50 veh/km and given sigma = 1 the break-down may also occur at 30 veh/km.
Some tests cases can be obtained at
Fundamental diagram on a straight piece of road#
Reducing the speed spontaneously#
It's possible to observe spontaneous breakdown given the sufficient length of road, and the right configuration of parameters, density and lane changing situations.
Some tests cases can be obtained at
- krauss_t0.9_s1
- krauss_t0.9_s0.8
- krauss_bikes_t1_s1
- krauss_bikes_sublane
- 2lane_krauss_t0.8_s0.5
- 2lane_IDM
Note
These tests set a low value of --end to save time. To get a fuller fundamental diagram, increase the end time.

