Lane- or Edge-based Traffic Measures
Values within this output describe the situation within the network in terms of traffic science by giving macroscopic values such as the mean vehicle speed, the mean density, etc. This output can be generated either for lanes, edges or groups of edges.
In the following, it is described how both outputs are generated and which values they contain. Then, the meanings of the values are given as well as a description of intervals. At last, some additional possibilities to constrain the outputs are given.
Note
Please remark that these outputs are also called "aggregated lane/edge states", "meandata", or "edge/lane-dumps".
Instantiating within the Simulation#
Meandata Definition#
An edge-based state dump is defined within an additional-file:
<additional>
    <edgeData id="<MEASUREMENT_ID>" file="<OUTPUT_FILE>" .../>
</additional>
For a lane based dump simply write:
<additional>
    <laneData id="<MEASUREMENT_ID>" file="<OUTPUT_FILE>" .../>
</additional>
The defined file can either be loaded with sumo option --additional-files FILENAME or declared in a .sumocfg file with <additional-files value="FILENAME"/>
Note
attribute 'id' is only used to distinguish outputs if there are multiple edgeData definitions. The value is otherwise arbitrary and does not influence written outputs.
For additional attributes see the table below.
| Attribute Name | Value Type | Description |
|---|---|---|
| id | id (string) | The id of this set of measurements. This user-defined id is needed for differentiating between multiple sets of measurements in a single output file. |
| file | filename | The path to the output file. The path may be relative. |
| period (alias freq) | int (time) | The aggregation period the values the detector collects shall be summed up. If not given the whole time interval from begin to end (see below) is aggregated. |
| begin | int (time) | The time to start writing (intervals starting before this time are discarded). If not given, the simulation's begin is used. |
| end | int (time) | The time to end writing (intervals starting at or after this time are discarded). If not given the simulation's end is used. |
| excludeEmpty | string (true, false, defaults, modified) | If set to true, edges/lanes which were not used by a vehicle during this period will not be written; default: false. If set to "defaults" default values for travel time and speed depending on edge length and maximum speed get printed, "modified" will print values only for empty edges which have a dynamically adapted maximum speed. |
| withInternal | bool | If set, junction internal edges/lanes will be written as well; default: false. |
| maxTraveltime | float (time) | The maximum traveltime in seconds to write if only very small movements occur; default 100000. |
| minSamples | float (time) | The minimum total number of seconds vehicles have to be on the edge / lane to consider it non-empty; default: >0. |
| speedThreshold | float (m/s) | The maximum speed to consider a vehicle halting; default 0.1. |
| speedThresholdRelative | float | The maximum relative speed (vehSpeed / speedLimit) to consider a vehicle halting; default 0. Note: When this is set, waitingTime may be larger than timeLoss |
| vTypes | string | space separated list of vehicle type ids to consider. If not given, all vTypes will be considered. |
| trackVehicles | bool | whether aggregation should be performed over all vehicles that entered the edge/lane in the aggregation interval |
| detectPersons | string list | whether pedestrians shall be recorded instead of vehicles. Allowed value is walk. Note: further modes are planned |
| writeAttributes | string list | list of attribute names that shall be written (defaults to all attribute) |
| edges | string list | restrict output to the given list of edge ids |
| edgesFile | filename | restrict output to the given the list of edges given in file (either one edgeID per line or an id prefixed with 'edge:' as in a selection file) |
| aggregate | bool or "taz" | Whether the traffic statistic of edges shall be aggregated. If set to "true" the data for all edges (potentially a subset configured with edges or edgesFiles) will be aggregated into a single value and the output edge id will be AGGREGATED). If set to "taz" then the statistics for all edges in a loaded TAZ will be aggregated into a single value and the output edge id will be the TAZ-id. This feature is also compatible with option --junction-taz to obtain aggregated output for every junction. |
Simplified definition#
If none of the additional attributes listed above are needed, a meandata definition can be declared without defining an additional file by setting one of the following options:
- --edgedata-output FILENAME
- --lanedata-output FILENAME
The generated definitions will be named DEFAULT_EDGEDATA and DEFAULT_LANEDATA respectively and will aggregate their values over the whole length of the simulation (edges without traffic will not be included in the output).
Generated Output#
Edge-Based Network States#
For edge-based state dumps, the output file will look like the following:
<meandata>
    <interval begin="<INTERVAL_BEGIN>" end="<INTERVAL_END>" id="<MEASUREMENT_ID>">
      <edge id="<EDGE_ID>" sampledSeconds="<COLLECTED_VEHICLE_SECONDS>" \
            traveltime="<MEAN_TRAVEL_TIME>" \
            density="<MEAN_DENSITY>" occupancy="<MEAN_OCCUPANCY>" \
            waitingTime="<TOTAL_WAITING_TIME>" speed="<MEAN_SPEED>" \
            departed="<EMITTED_VEH_NUMBER>" arrived="<ARRIVED_VEH_NUMBER>" \
            entered="<ENTERED_VEH_NUMBER>" left="<LEFT_VEH_NUMBER>" \
            laneChangedFrom="NUMBER_OF_LANE_LEAVERS" laneChangedTO="NUMBER_OF_LANE_ENTERER"/>

      ... more edges ...

    </interval>

    ... further intervals ...

</meandata>
Please note, that in contrary to the example above, for each edge, all values are reported in one line.
Lane-Based Network States#
The generated output looks like the following:
<meandata>
    <interval begin="<INTERVAL_BEGIN>" end="<INTERVAL_END>" id="<MEASUREMENT_ID>">
      <edge id="<EDGE_ID>">
          <lane id="<LANE_ID>" sampledSeconds="<COLLECTED_VEHICLE_SECONDS>" \
                traveltime="<MEAN_TRAVEL_TIME>" \
                density="<MEAN_DENSITY>" occupancy="<MEAN_OCCUPANCY>" \
                waitingTime="<TOTAL_WAITING_TIME>" speed="<MEAN_SPEED>" \
                departed="<EMITTED_VEH_NUMBER>" arrived="<ARRIVED_VEH_NUMBER>" \
                entered="<ENTERED_VEH_NUMBER>" left="<LEFT_VEH_NUMBER>" \
                laneChangedFrom="<NUMBER_OF_LANE_LEAVERS>" laneChangedTo="<NUMBER_OF_LANE_ENTERER>" \
                speedRelative="<MEAN_SPEED_RELATIVE>" />

          ... more lanes...

      </edge>

      ... more edges ...

    </interval>

    ... further intervals ...

</meandata>
Please note, that in contrary to the example above, for each lane, all values are reported in one line.
Value Descriptions#
Both the edge-dump and the lane-dump are computing the values the same way: every vehicle move - even those with v=0 - is recorded and saved during the interval. After the interval has passed, these values are written into the file after being normalized.
With regard to edgeData density, the values are normalized by the number of the
collected vehicle movements and the length of the lane. For laneDensity they are also normalized by the
number of lanes of the edge.
The meanings of the written values are given in the following table.
| Name | Type | Description |
|---|---|---|
| begin | (simulation) seconds | The first time step the values were collected in |
| end | (simulation) seconds | The last time step + DELTA_T in which the reported values were collected |
| edge@id | (edge) id | The name of the reported edge |
| lane@id | (lane) id | The name of the reported lane |
| sampledSeconds | s | The number of vehicles that are present on the edge/lane in each second summed up over the measurement interval (may be subseconds if a vehicle enters/leaves the edge/lane). |
| traveltime | s | Time needed to pass the edge/lane, note that this is just an estimation based on the mean speed, not the exact time the vehicles needed. The value is based on the time needed for the front of the vehicle to pass the edge. |
| overlapTraveltime | s | Time needed to pass the edge/lane completely, note that this is just an estimation based on the mean speed, not the exact time the vehicles needed. The value is based on the time any part of the vehicle was the edge. |
| density | #veh/km | Vehicle density on the edge |
| overlapDensity | #veh/km | Vehicle density on the edge. This value counts vehicles if any part along it's length touches the edge. This should not be used for flow computation |
| laneDensity | #veh/km/lane | Vehicle density on the edge per lane |
| occupancy | % | Occupancy of the edge/lane in %. A value of 100 would indicate vehicles standing bumper to bumper on the whole edge (minGap=0). |
| waitingTime | s | The total number of seconds vehicles were considered halting (speed < speedThreshold). Summed up over all vehicles |
| timeLoss | s | The total number of seconds vehicles lost due to driving slower than desired (summed up over all vehicles) |
| speed | m/s | The mean speed on the edge/lane within the reported interval. Caution: This is an average over time and space (space-mean-speed), rather than a local average over the vehicles (time-mean-speed). Since slow vehicles spend more time on the edge they will have a proportionally bigger influence on average speed. |
| speedRelative | - | quotient of mean speed value (see above) and the lane speed limit |
| departed | #veh | The number of vehicles that have been emitted onto the edge/lane within the described interval |
| arrived | #veh | The number of vehicles that have finished their route on the edge lane |
| entered | #veh | The number of vehicles that have entered the edge/lane by moving from upstream |
| left | #veh | The number of vehicles that have left the edge/lane by moving downstream |
| laneChangedFrom | #veh | The number of vehicles that changed away from this lane |
| laneChangedTo | #veh | The number of vehicles that changed to this lane |
| vaporized | #veh | The number of vehicles vaporized on this edge (only present if #veh > 0) |
| teleported | #veh | The number of vehicles teleported from this edge (only present if #veh > 0) |
| flow | #veh/hour | The number of vehicles passing this edge per hour. Vehicles that depart on this edge beyond position 0 or arrive before the end of the edge are fractionally disocunted |
Please note that in the case of edge meandata both laneChanged entries are equal to the total number of lane changes on the edge. Furthermore each lane change is counted separately, that means if one vehicle changes from lane 1 to lane 3 it will generate two lane change counts.
How to aggregate / derive further values#
In order to aggregate the output for the same edge / lane over larger time periods the values which count vehicles have to be simply summed, density and occupancy can be simply averaged (if the interval lengths are equal) and speed should be a weighted average with sampledSeconds as weight. To aggregate the traveltime further, calculate the mean speed first and then divide edge/lane length by the speed.
Spatial aggregation (over multiple edges or lanes) is not as easy, especially if they are consecutive, because each vehicle generates data on each lane it is on, even if it is on multiple lanes. In the case of many short and fast moving vehicles the error is negligible but if you have long and slow vehicles you cannot aggregate as above.
The following measurements can be derived from the values given (period denotes the length of the aggregation interval):
- Average number of vehicles on the edge (#) =
sampledSeconds / period - Average traffic volume (#/h) =
speed * 3.6 * density - Traffic volume at the begin of the lane / edge (#/h) =
3600 * entered / period - Traffic volume at the end of the lane / edge (#/h) =
3600 * left / period - Total distance travelled (m) =
speed * sampledSeconds - Edge length =
sampledSeconds / period * 1000 / density
Sometimes one wants to know how many vehicles were on an edge. The exact definition of this value depends on how departed, arrived and lane-changing vehicles are counted. Each vehicle is either in arrived, left or laneChangedFrom and each vehicle is also either in departed, entered or laneChangedTo. However, a vehicle may be counted multiple times in laneChangedFrom and laneChangedTo if it performed back-and-forth lane changing.
The following <edgeData> values are all reasonable counts in that they count each
vehicle only once but they include/exclude some special cases.
- entered
- entered + departed
- left
- left + arrived
Note
When using <laneData> the sum left + arrived excludes all the vehicles that exited the lane by lane-changing. whereas the sum left + arrived + laneChangedFrom may count vehicles multiple times. If total counts on a lane are needed it is better to use a detector.
Notes#
- Per default, all edges are written, even those on which no vehicle
drove. If the lane / edge collected no data the attributes speed,
traveltime, density, occupancy and waitingTime are not written. One
can disable writing unused edges/lanes by setting the
excludeEmptyattribute to "true". Setting it tomodifiedwill print the empty edges if they have been modified by calibrators, variable speed signs or TraCI. - Even on lanes/edges which have sampledSeconds="0.00" since the real
number of sampledSeconds may be 0.001 and was cut off in the output.
To define a minimum number of samples before you consider your data
valid, use
minSamplesin the meandata definition. - Even though no data was collected (sampledSeconds="0") departed and laneChangedTo may be different from 0 because internally lane changes and departures happen at the end of a time step.
- The interval end is the interval begin + aggregation time, meaning that values were collected within these steps excluding the end time itself. If the simulation ends before the last interval is over, the interval will be pruned.
- The output file will be generated, does not have to exist earlier and will be overwritten if existing without any warning. The folder the output file shall be generated in must exist.
- If you need only information about the network states during certain
time periods, you may constraint generation of the dumps by creating
multiple dumps with the attributes
begin=""andend="". All of them may have identical ids and write to the same output file.
Visualization / Plotting#
- sumo-gui can load edgeData files and color network edges/lanes according to any of its attributes
- sumo-gui can color edges/lanes by any of the attributes being collected while the simulation is running
- netedit can be used to load/view/edit edgeData files
- The mpl_dump_onNet.py script can display values of this output as a colored net (and further visualization tools exist).
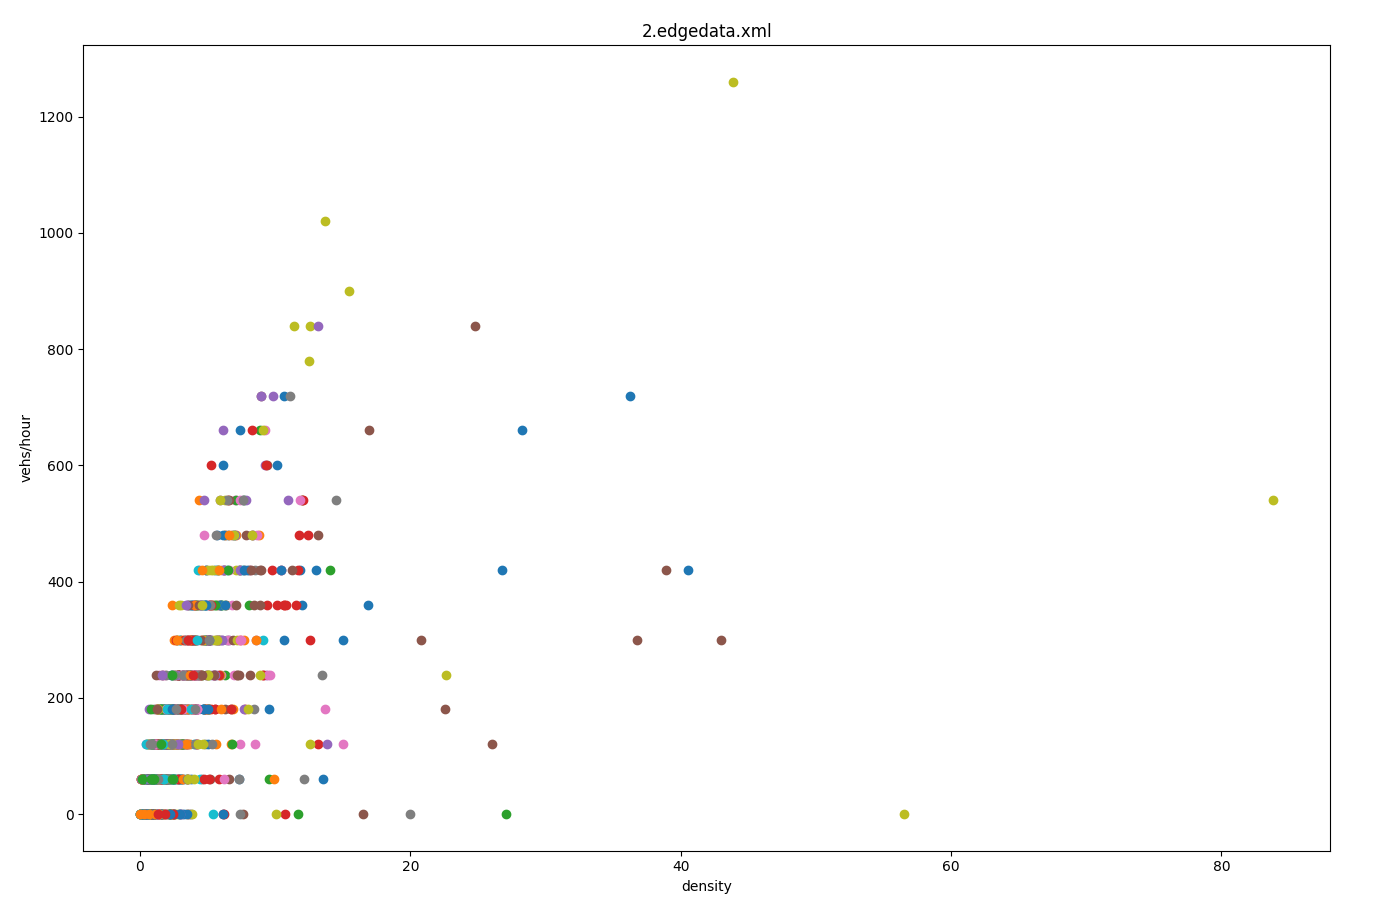
- plotXMLAttributes can extract and plot values such as the Fundamental Diagram below
See Also#
- edge/lane-based vehicular pollutant emission output and edge/lane-based vehicular noise emission output which have similar formats
- You can generate mean data definitions automatically. See output tools for more information.